Flocker 1.1


is a free software to quantify and compare

statistical measures of group size.


Download:


Briefly

This is a statistical toolset designed to analyse group size data while:

  • differentiating between outsiders' view (group size) versus insiders' view (crowding) measures;

  • controlling for the ties among data points in the latter case;

  • handling biased distributions correctly.

Theoretical background, examples, and a description of statistical procedures are found here:


Reiczigel et al. 2008. Measures of sociality: two different views of group size. Animal Behaviour 75: 715-721.


The software is free to use and distribute for scientific and educational purposes.

Please cite the above article as a theoretical background of the statistical procedures.


How to run

Runs under Windows. After download, unzip the file and find a folder named 'Flocker 11'. Do not remove the files from the folder. Within this folder, you just

     •  right click (i.e. use the right mouse button to click) the file named 'flocker11.exe'

     •  then select 'run as administrator'.

No Mac version is available.


Details

Many animals, including humans, tend to live in groups (herds, flocks, bands, packs, parties, or colonies) of conspecific individuals. The size of these groups, as expressed by the number of participants, is an important aspect of their social environment. Group size tend to be highly variable even within the same species, thus we often need statistical measures to quantify group size and statistical tests to compare these measures between two or more samples. Unfortunately, group size measures are notoriously hard to handle statistically since values typically exhibit an aggregated (right-skewed) distribution; most groups are small, few are large, and a very few are very large. Statistical measures of group size roughly fall into two categories.


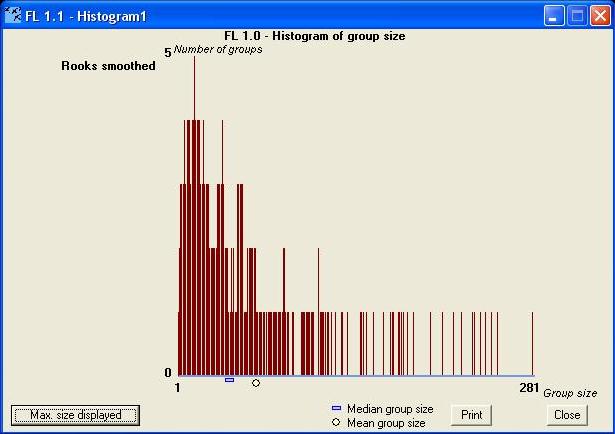
1. Outsiders’ view of group size

  • Group size is the number of individuals within a certain group;

  • Mean group size, i.e. the arithmetic mean of group sizes averaged across groups;

  • Confidence interval of mean group size (e.g. P=95% probability);

  • Median group size, i.e. the median of group sizes calculated across groups;

  • Confidence interval of median group size.


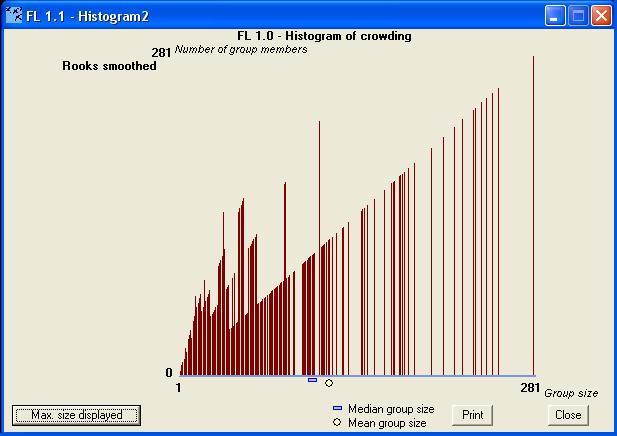
2. Insiders’ view of group size

As Jarman (1974) pointed out, average individuals live in groups larger than the average – simply because the groups smaller than average have fewer individuals than the groups larger than average. (Except for an unrealistic case when all groups are of equal size.) Therefore, when we wish to characterize a typical (average) individual’s social environment, we should not apply the outsiders’ view of group size. Reiczigel et al. (2008) proposed the following measures:

  • Crowding is the number of individuals within a group

                (this equals to group size: 1 for a solitary individual, 2 for both individuals in a group of 2, etc.);

  • Mean crowding, i.e. the arithmetic mean of crowding values averaged across individuals

                (this was called "Typical Group Size" in Jarman's terminology);

  • Confidence interval of mean crowding.


Animal group size data tend to exhibit aggregated (right-skewed) distributions, i.e. most groups are small, a few are large, and a very few are very large. The distribution of rook colony sizes in Normandy, 1999-2000 (smoothed). Mean colony size is 60 pairs. (Data from Debout, 2003)

Though large colonies are rare, however, they still incorporate a lot of individuals. Insiders' view of the same data set as on the left: the distribution of individuals (pairs) across colonies of different sizes. An average individual breeds in a colony of 120 pairs, far larger than mean colony size.


3. Statistical methods

Due to the aggregated (right-skewed) distribution of group members among groups, the application of parametric statistics would be misleading. Another problem arises due to the 'ties' among data. Crowding data consist of non-independent values, so-called ties, which show multiple and simultaneous changes in response to a single biological event. Say, all group members' crowding values increase simultaneously whenever an individual joins the group. The papers by Reiczigel et al. (2005, 2008) discuss the statistical problems associated with crowding measures (calculating confidence intervals, 2-sample tests, etc.) and Flocker1.1 provides a cost-free and user-friendly toolset to carry out these calculations.


Literature

 
Debout G 2003. Le corbeau freux (Corvus frugilegus) nicheur en Normandie: recensement 1999 & 2000. Cormoran 13: 115-121.  
Jarman PJ 1974. The social organisation of antelope in relation to their ecology. Behavior 48: 215-267.  
Reiczigel J et al. 2005. Properties of crowding indices and statistical tools to analyze crowding data. Journal of Parasitology 91: 245-252.  
Reiczigel J et al. 2008. Measures of sociality: two different views of group size. Animal Behaviour 75: 715-721.  


This page is on-line since the February of 2008.  

Last updated on 09. 08. 2017.

Maintained by Lajos RÓZSA.

 return